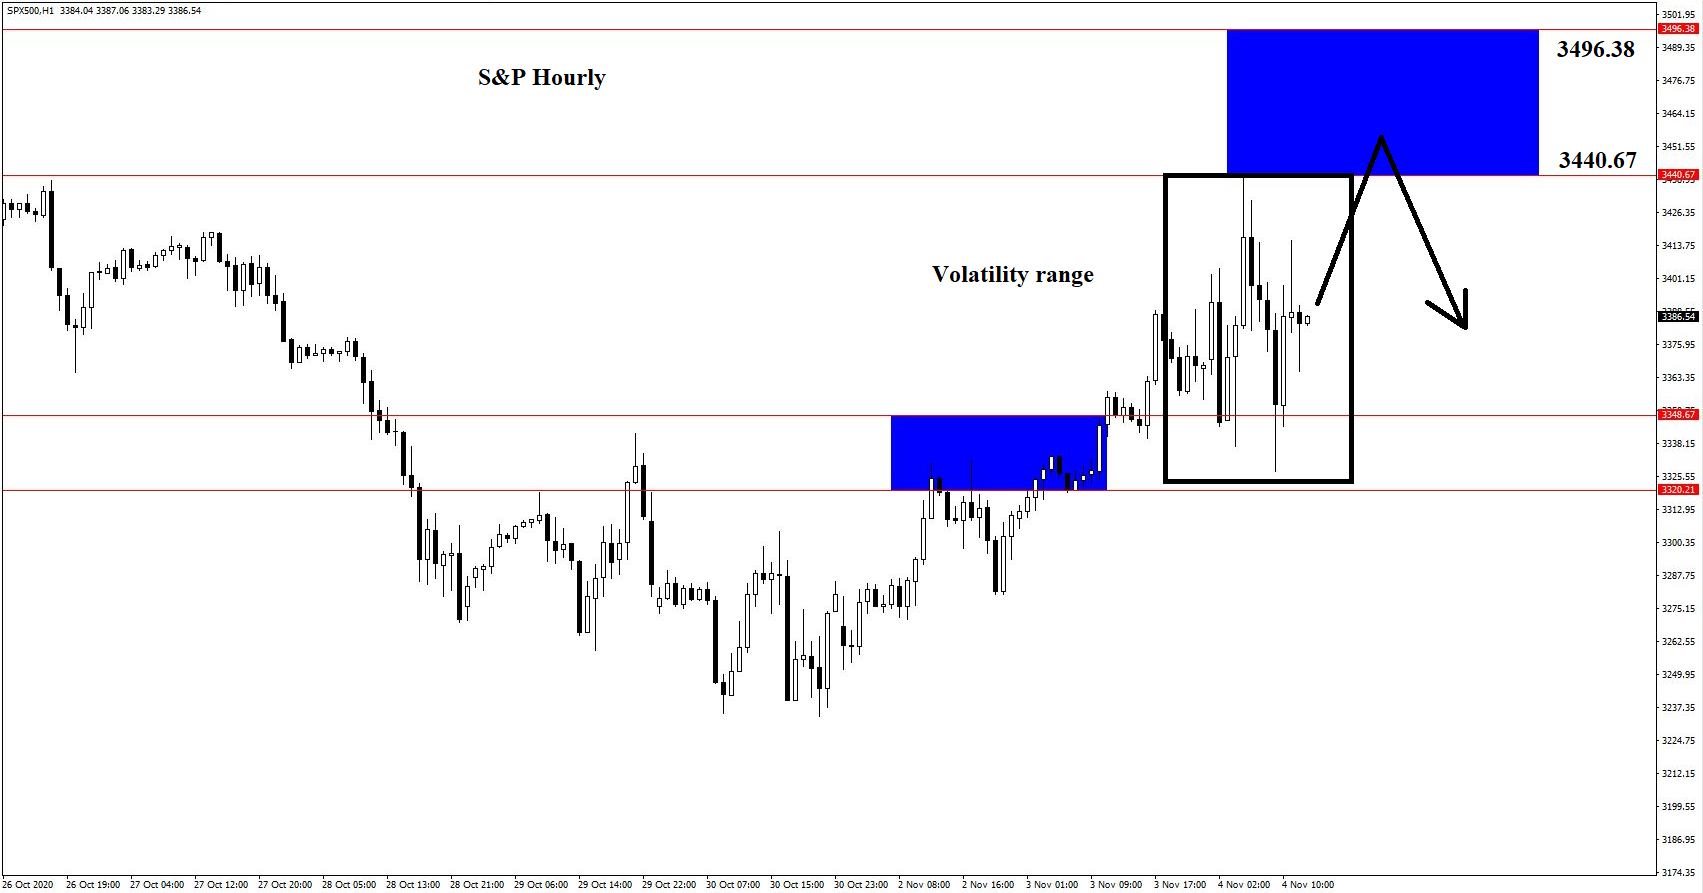
The S&P500 appears to have established a volatility range as election results are appearing. There is room for a potential Blue Box short on the hourly.
The resistance area is 3440.67-3496.38. There is no need to wait for a second bearish reversal in this case, as it is established resistance. A simple bearish candlestick reversal once price goes up to activate this Blue Box again will suffice.
US elections continue to be a mix, with Biden apparently leading the race for the electoral college but Trump leading the popular vote. Although trades have been acceptable, it doesn’t appear that the setups have caught the “big one” yet. That is likely to be a potential short on the equity markets, but there is no setup showing yet. For now, AUDCAD may provide an hourly setup.
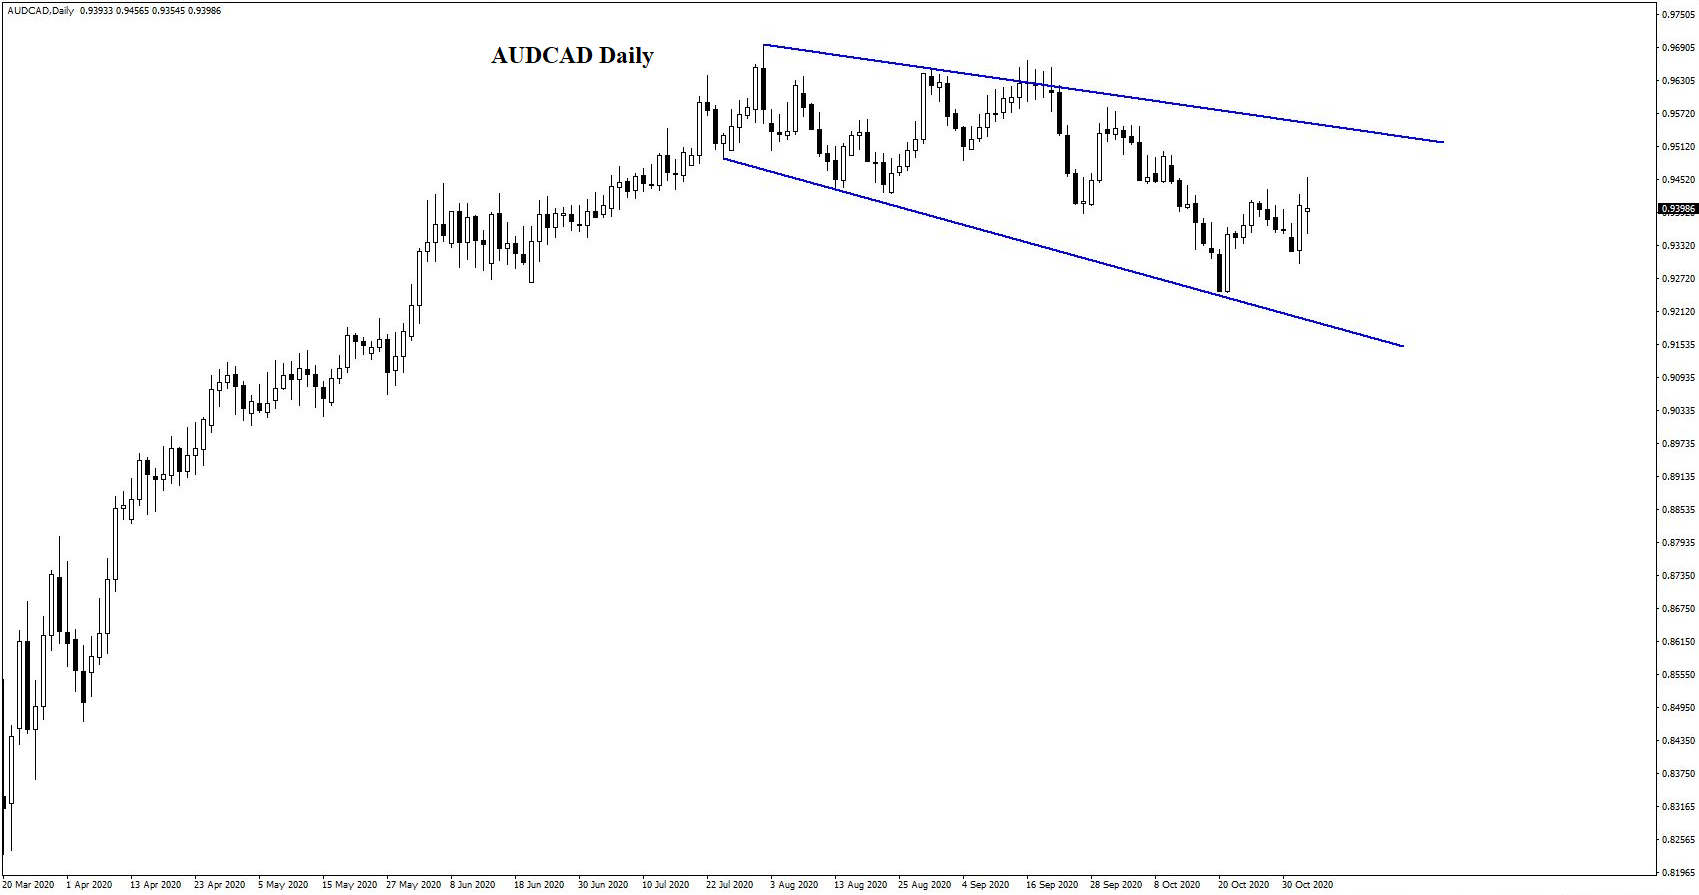
The daily chart shows a weak downtrend in progress. Thus far, there is nothing of particular interest on this timeframe beyond this.
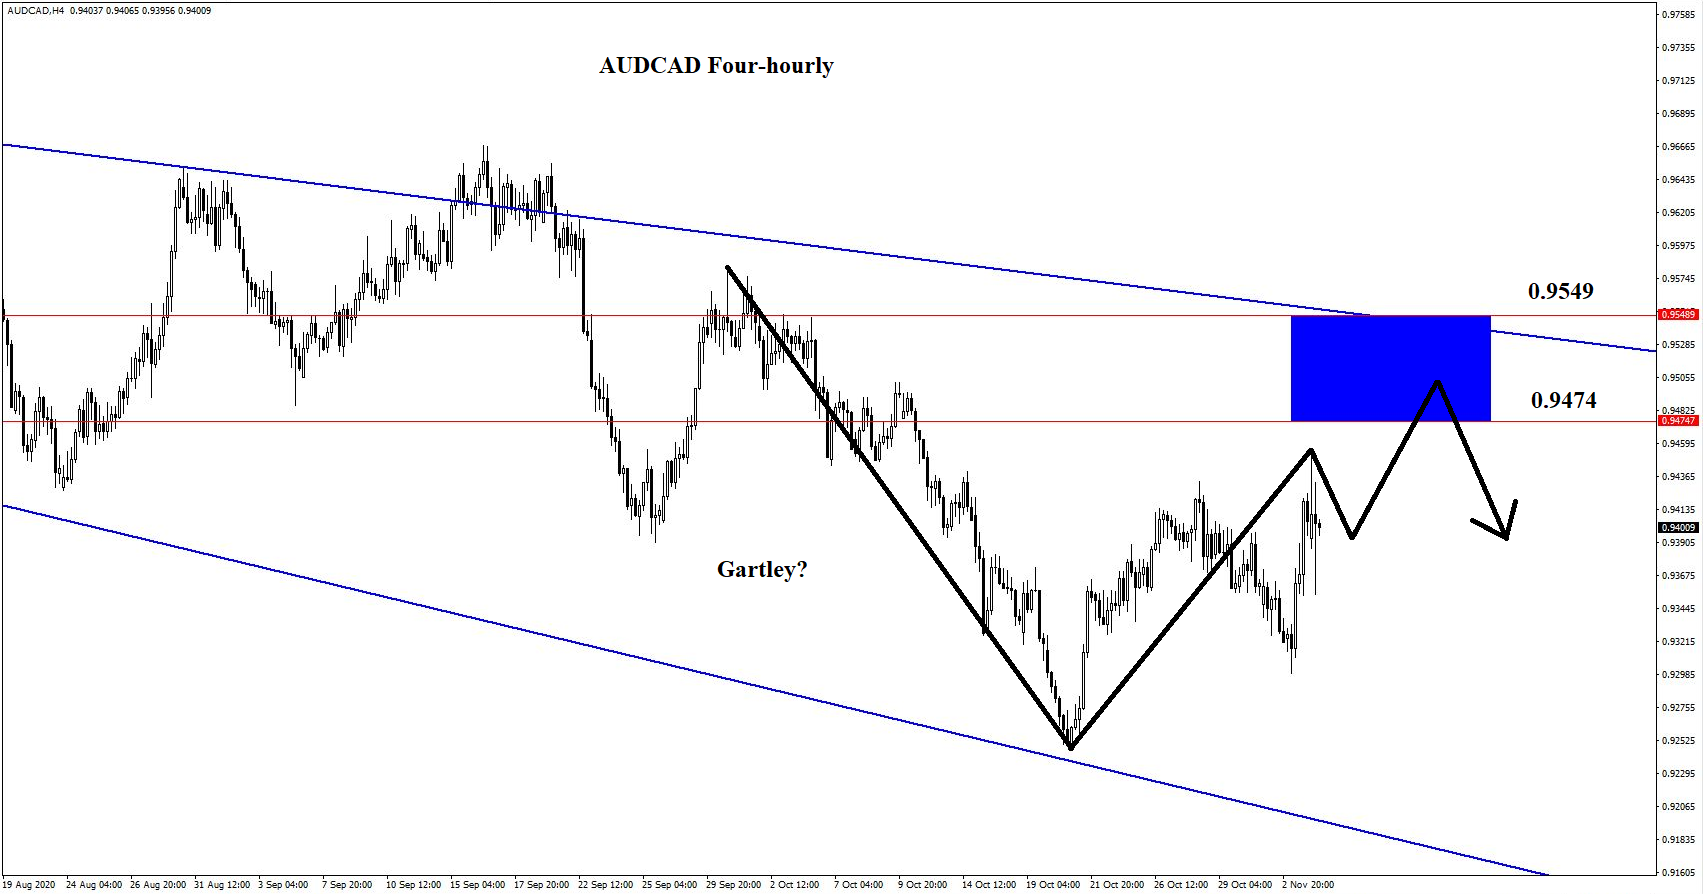
The four-hourly chart is showing a potential Gartley termination zone at 0.9474-0.9549. We are waiting for the Box to activate by having price touch it.
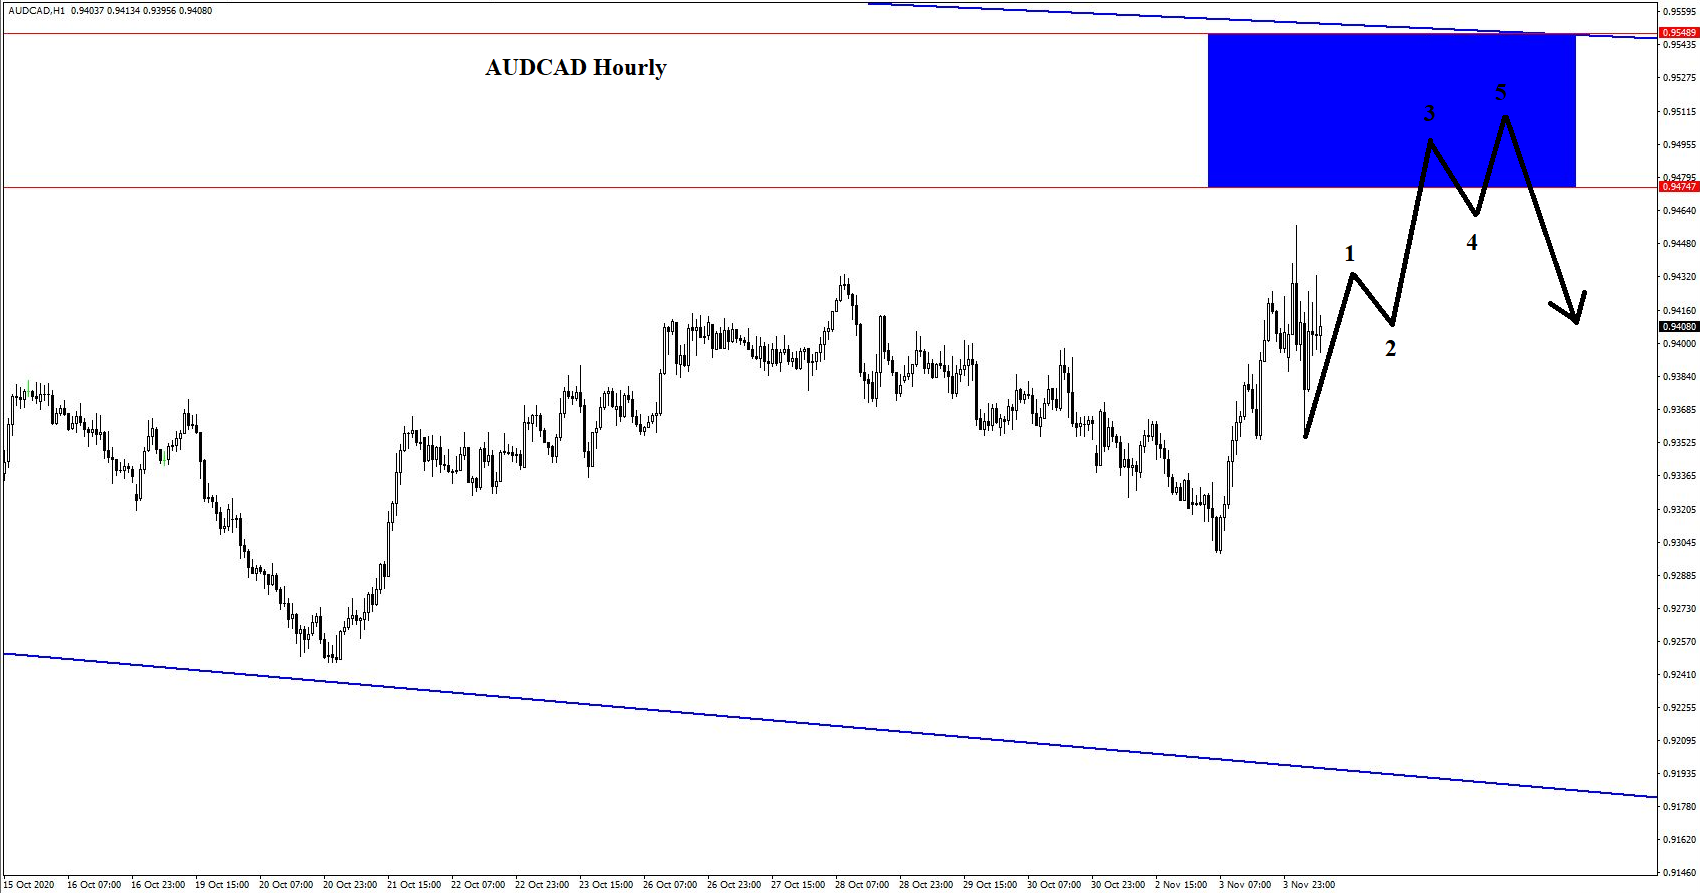
The hourly chart shows that we might have a bit of a wait yet, but because the election volatility is in play, we will not bother counting Elliott waves. As long as the Box is hit, it will be assumed that that is a valid wave 3. Traders can choose to take the second bearish candlestick reversal short after the Box is activated, assuming it is a wave 5. Two attempts per Box permitted, as usual. See earlier posts for more detailed instructions.
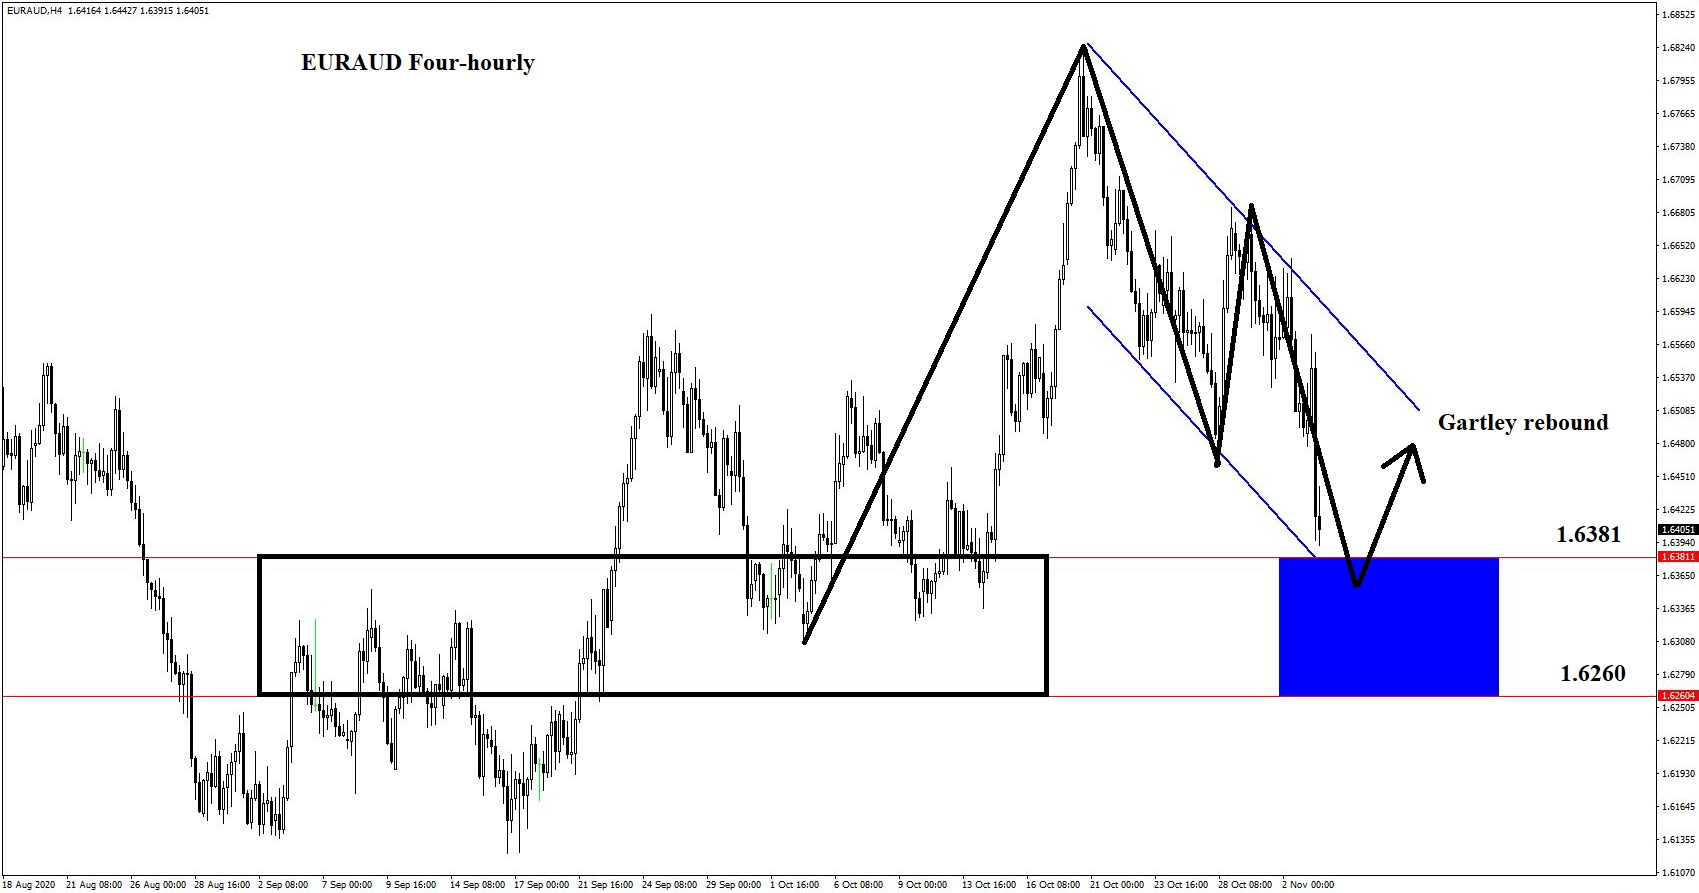
As EURUSD is showing too much bullish momentum, breaking two Blue Boxes in a row. It is perhaps better to obtain a trade setup on another Euro pair – EURAUD. The elimination of the US dollar component should help, although the trade-off is that the other Euro pairs are trend as well. Nonetheless, here is the four-hourly chart of EURAUD.
A potential Gartley pattern is visible on this pair, although the Blue Box zone has been adjusted to account for the confluence of the top and bottom of two consolidation zones, giving the area of interest 1.6260-1.6381. Although this Box is rather large, the trade trigger timeframe is likely to be the hourly, and thus this is not entirely unreasonable.
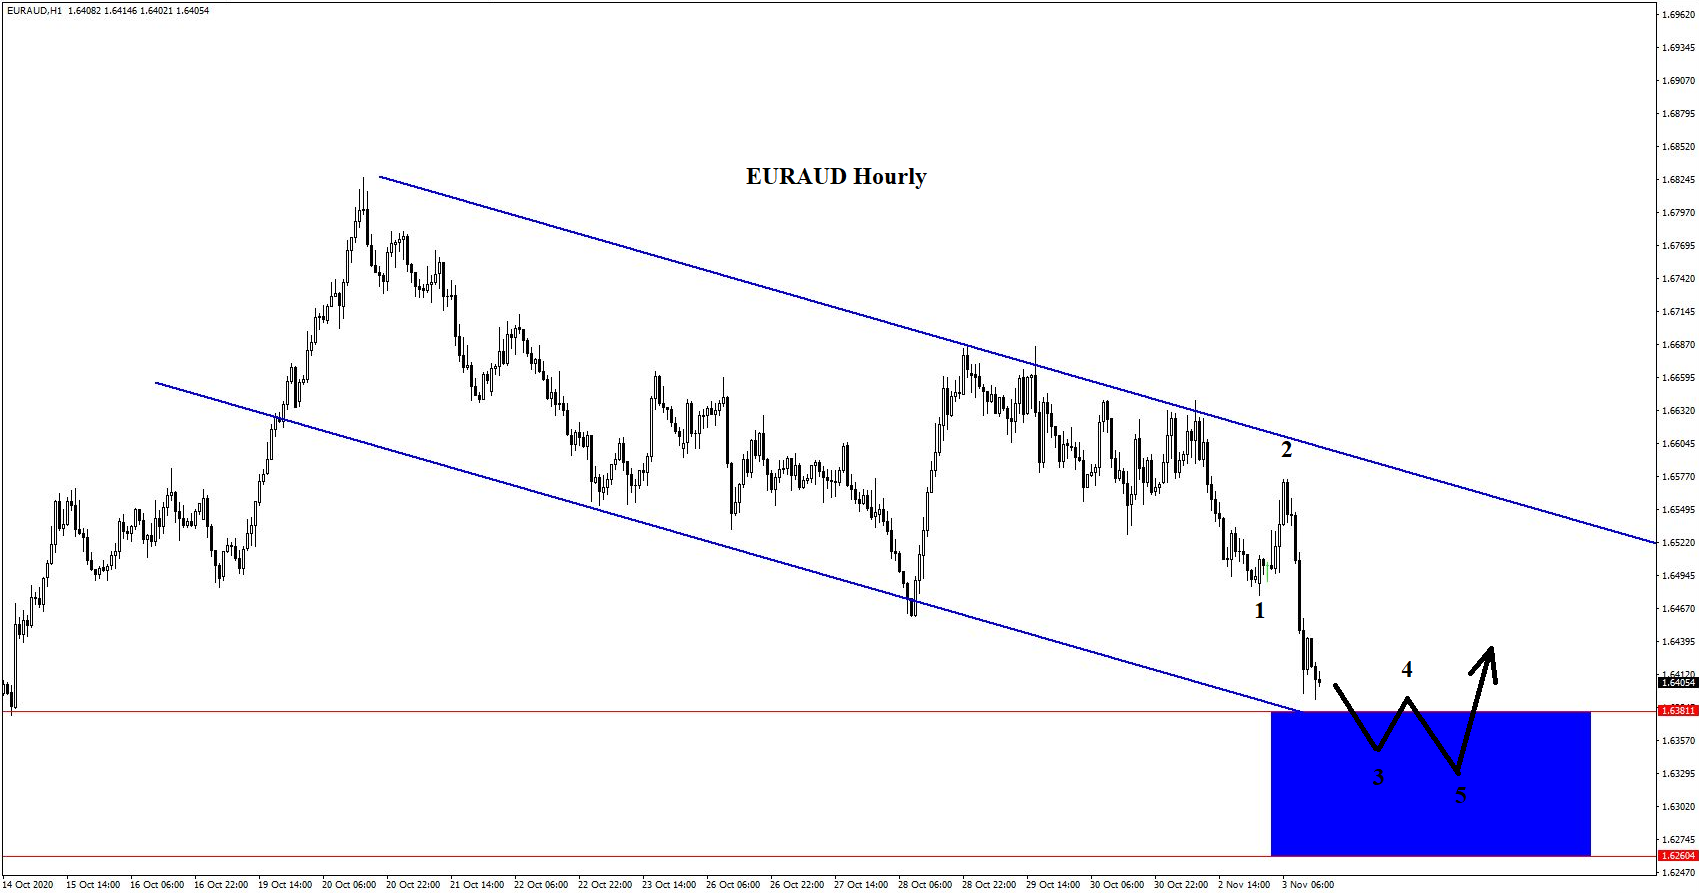
The hourly setup is the usual five-wave Elliott pattern. I have mentioned the double bullish candlestick pattern reversal in many other posts, and this applies here as we attempt to catch the bottom of wave 5. The hourly is the trigger timeframe.
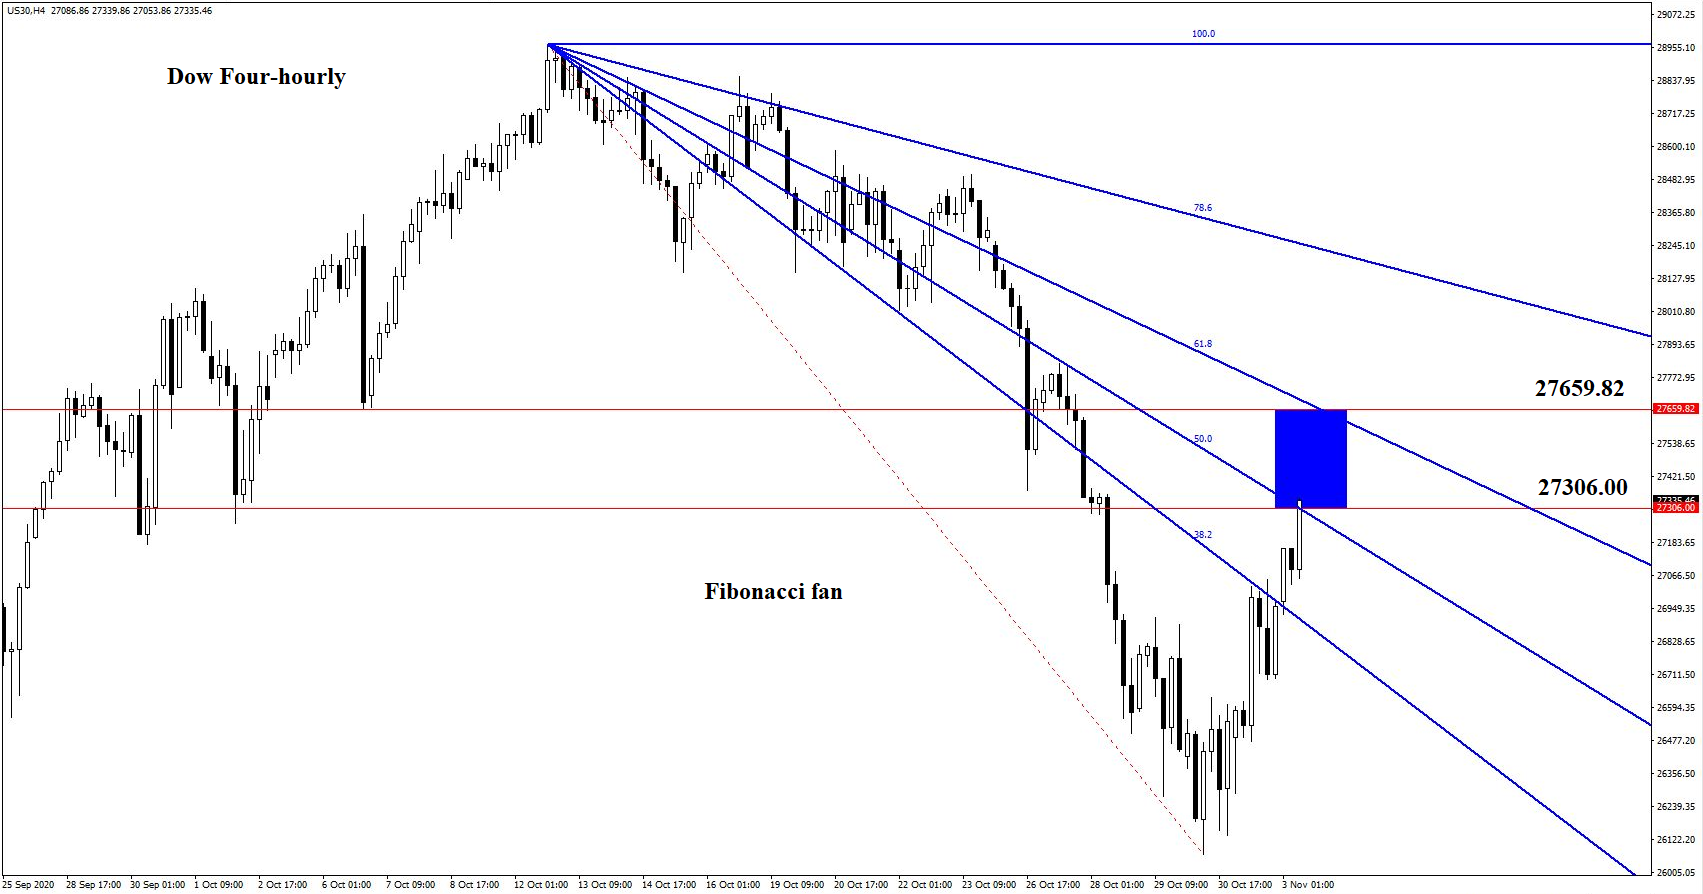
A rather interesting situation is developing. The Dow failed to trigger long by not activating the Blue Box originally published, and then overshot the 15-minute Blue Box short setup just enough to not justify a trade. As it rises rapidly, it is now in an interesting region for an hourly short.
This is how things currently stand. It has done a high-momentum rise from the low towards a zone defined by the 50% and 61.8% angles of a Fibonacci fan, which delineates areas of time and price turning points. As a rule of thumb, it is useful to assume that a reasonable pullback in a trend will turn from the 38.2%-61.8% region of the fan. This is too large an area for consideration, but as the 38.2% level has now been definitively breached, it is fine to consider the 27306.00-27659.82 zone to be potential resistance.
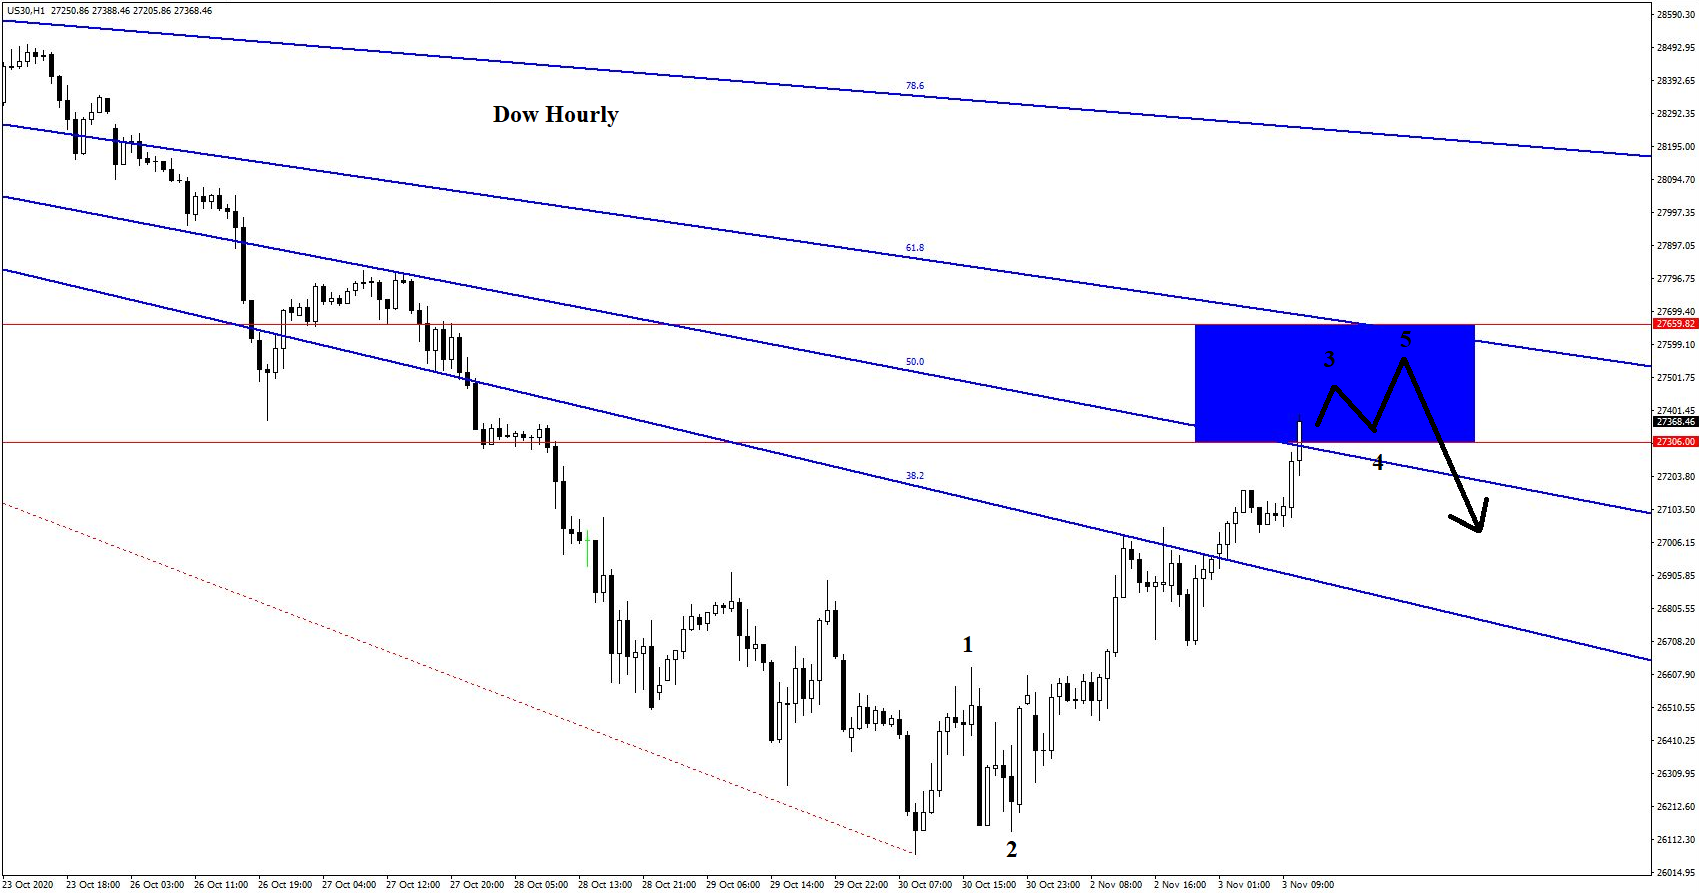
Elliott wave-wise, the move appears to a potential extended wave 3 on the hourly chart. The hourly is the trigger chart, where traders should attempt to enter on a second bearish candlestick reversal pattern (the first being the termination of wave 3, and the second being the termination of wave 5). The usual conditions apply, and a second attempt is permitted for each Blue Box if the first trade fails.
This trade would align quite well with a Biden win, if expectations that a Democratic win would drop the market prove to be correct. Traders don’t know for certain, and this is as it should be. The price action continues to be the price action, and we can trade it as it develops.
We are now getting closer to the US election’s final results. The S&P setup triggered short yesterday and gave a nice 2:1 plus reward-for-risk trade. Yen is hesitating about giving a second high, but EURUSD is beginning to look interesting.
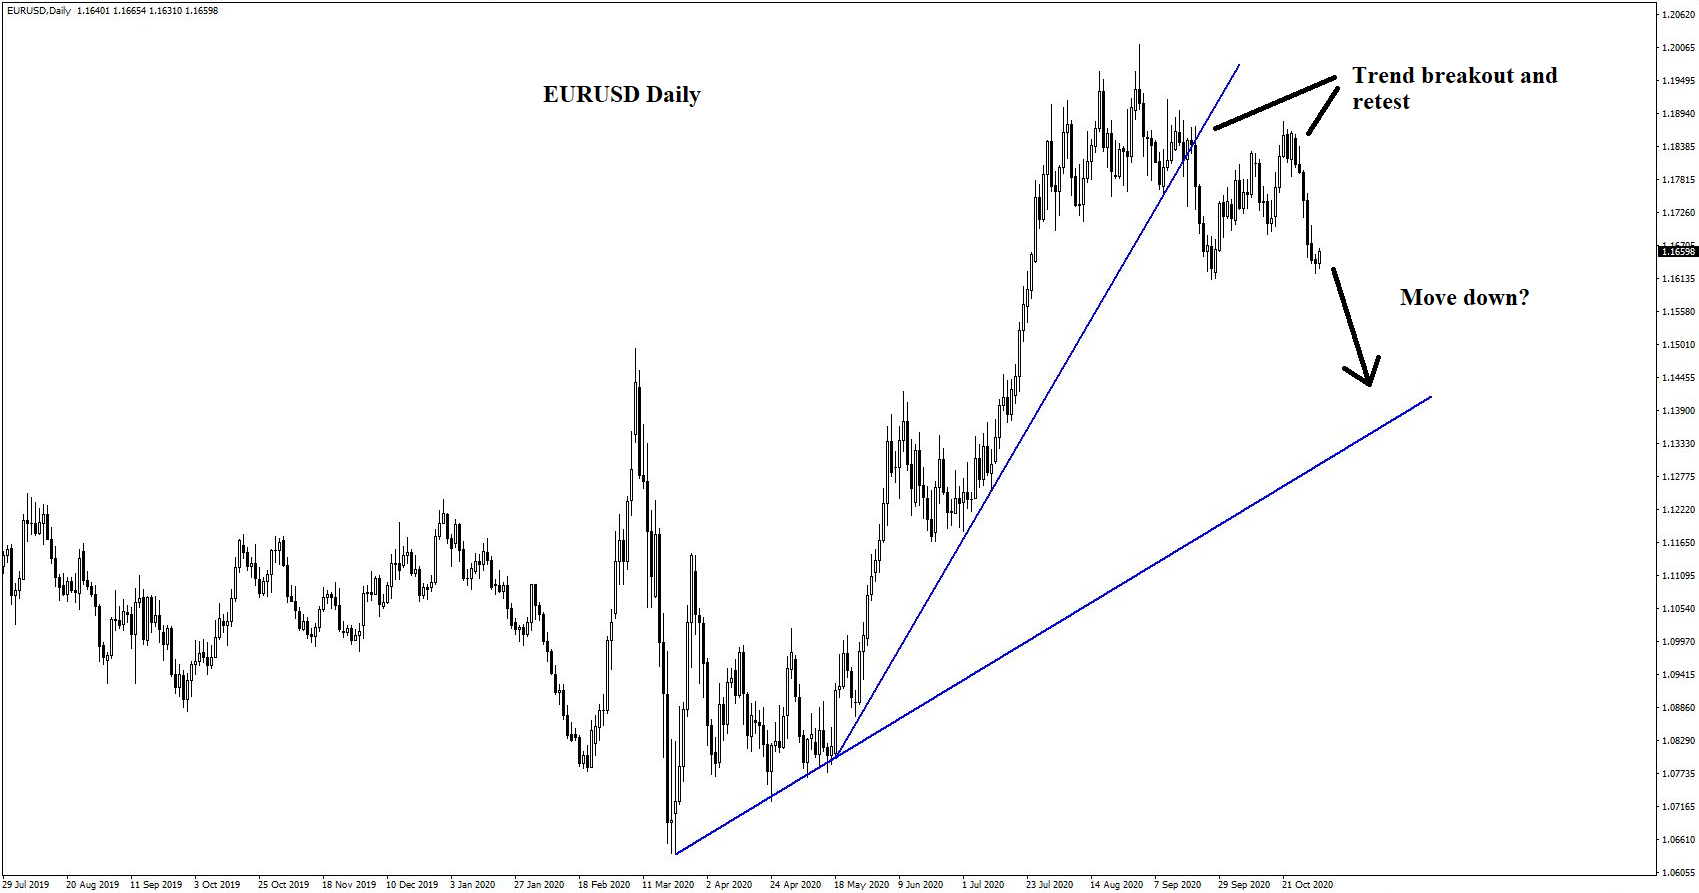
The daily chart of EURUSD still shows some bullishness, but a significant trendline has been broken and it is possible that prices will in the medium term be retracing towards the longer term trendline. Given that the goal is to identify trades which will trigger soon, this is sufficient justification to consider a small short trade.
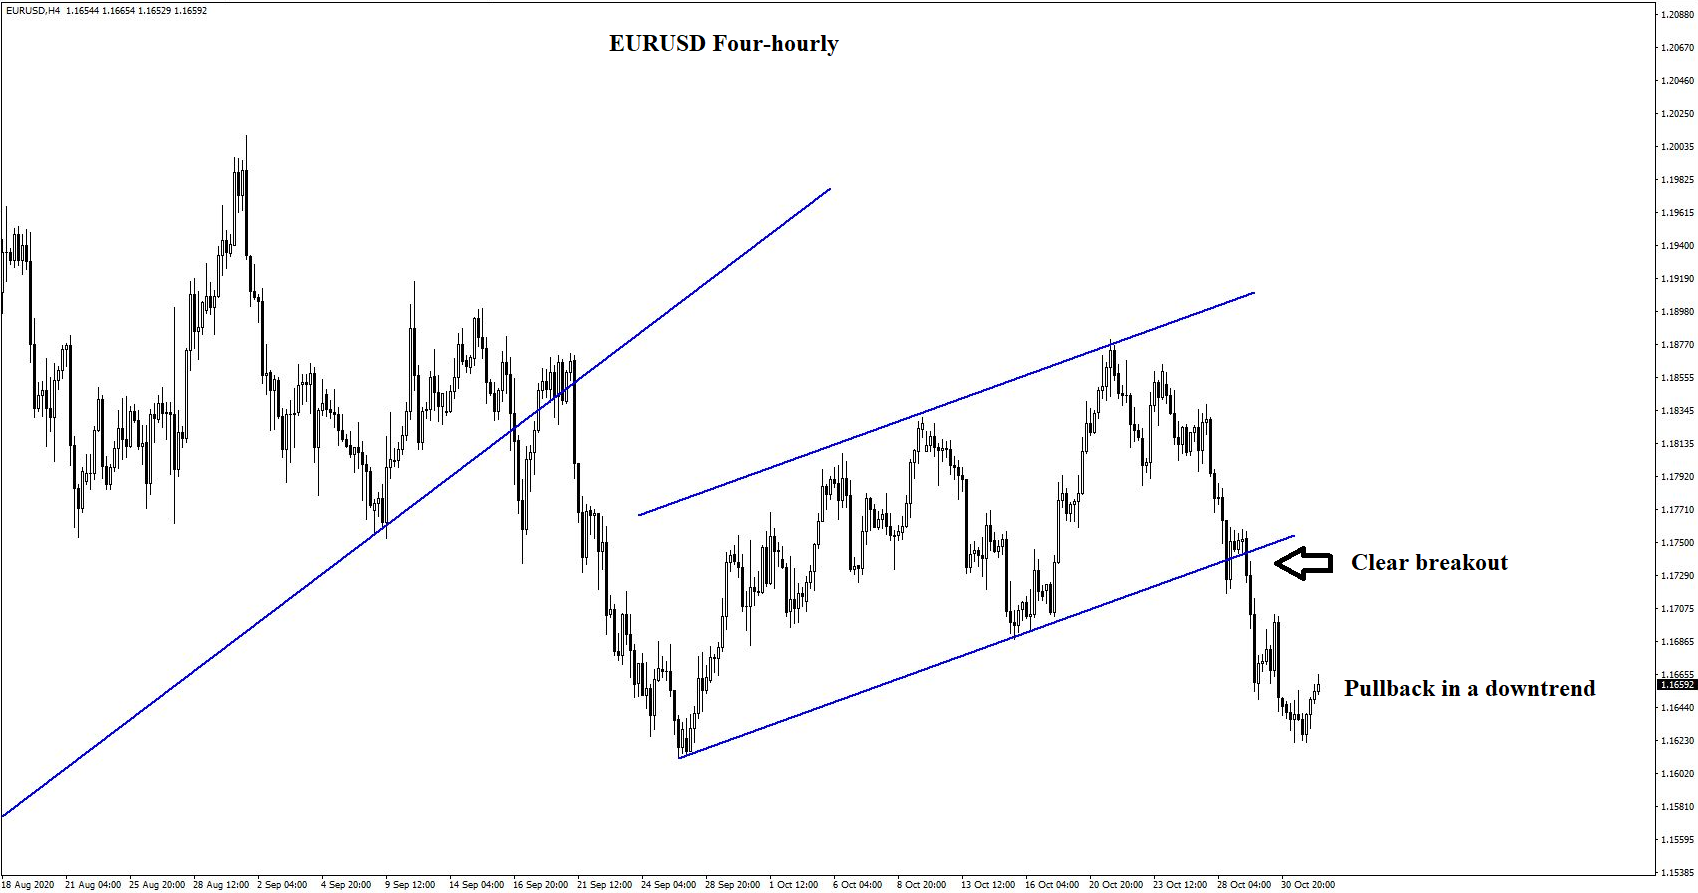
The four-hourly chart shows that a slightly rising channel has similarly been broken, and we are now observing a pullback on this timeframe. At the termination of this pullback, the dominant expectation would be for a swing downwards on the lower timeframes.
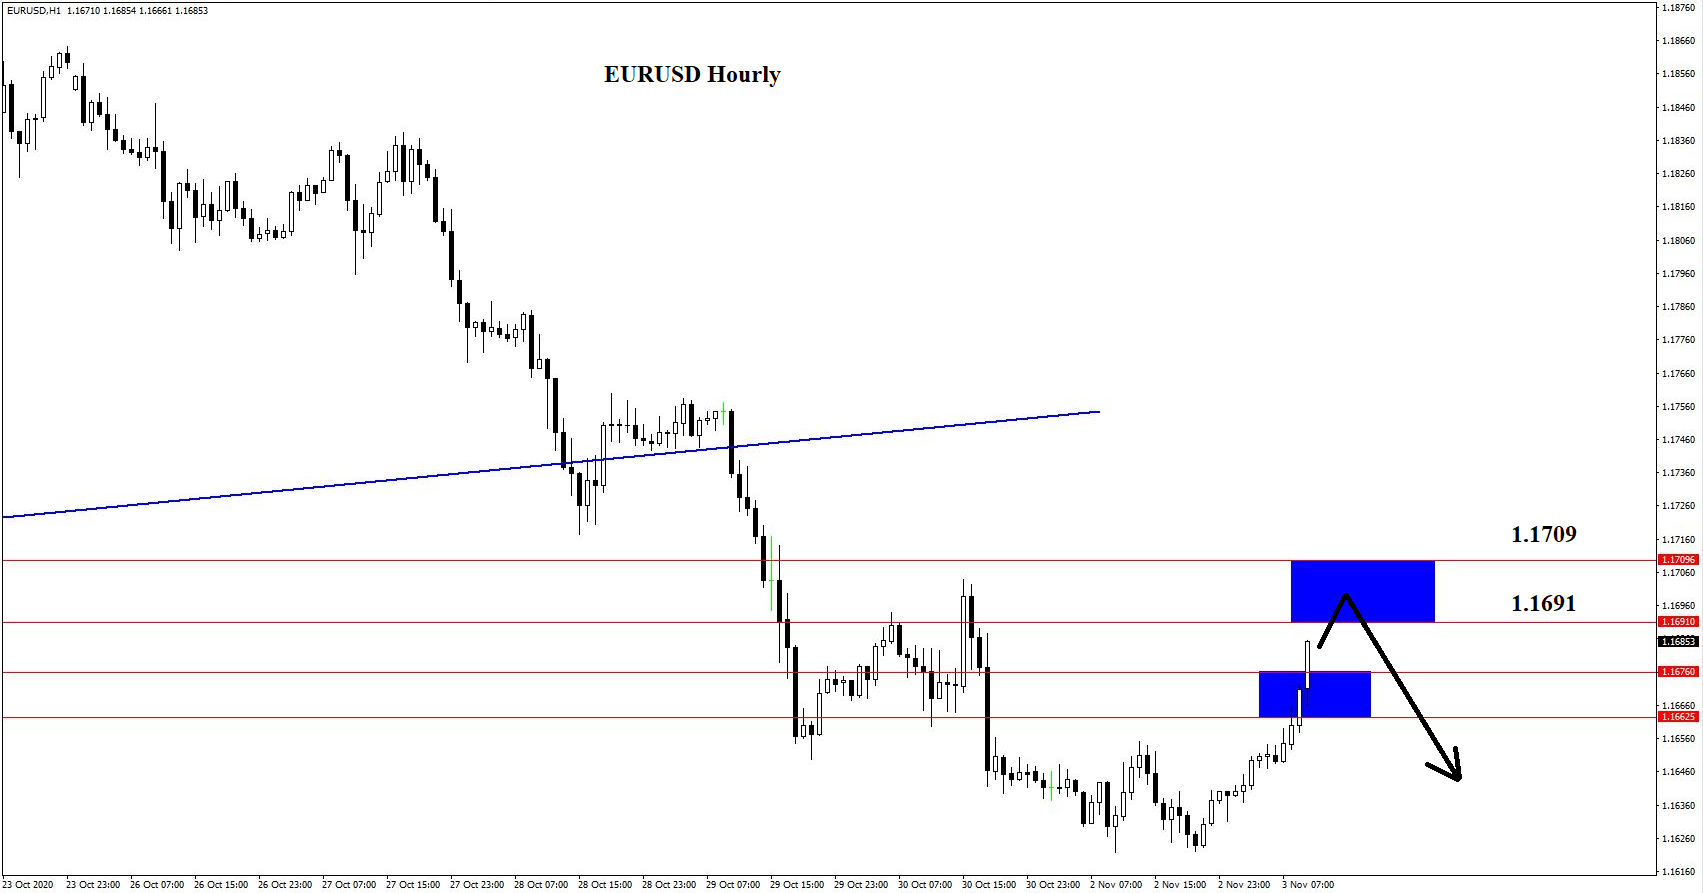
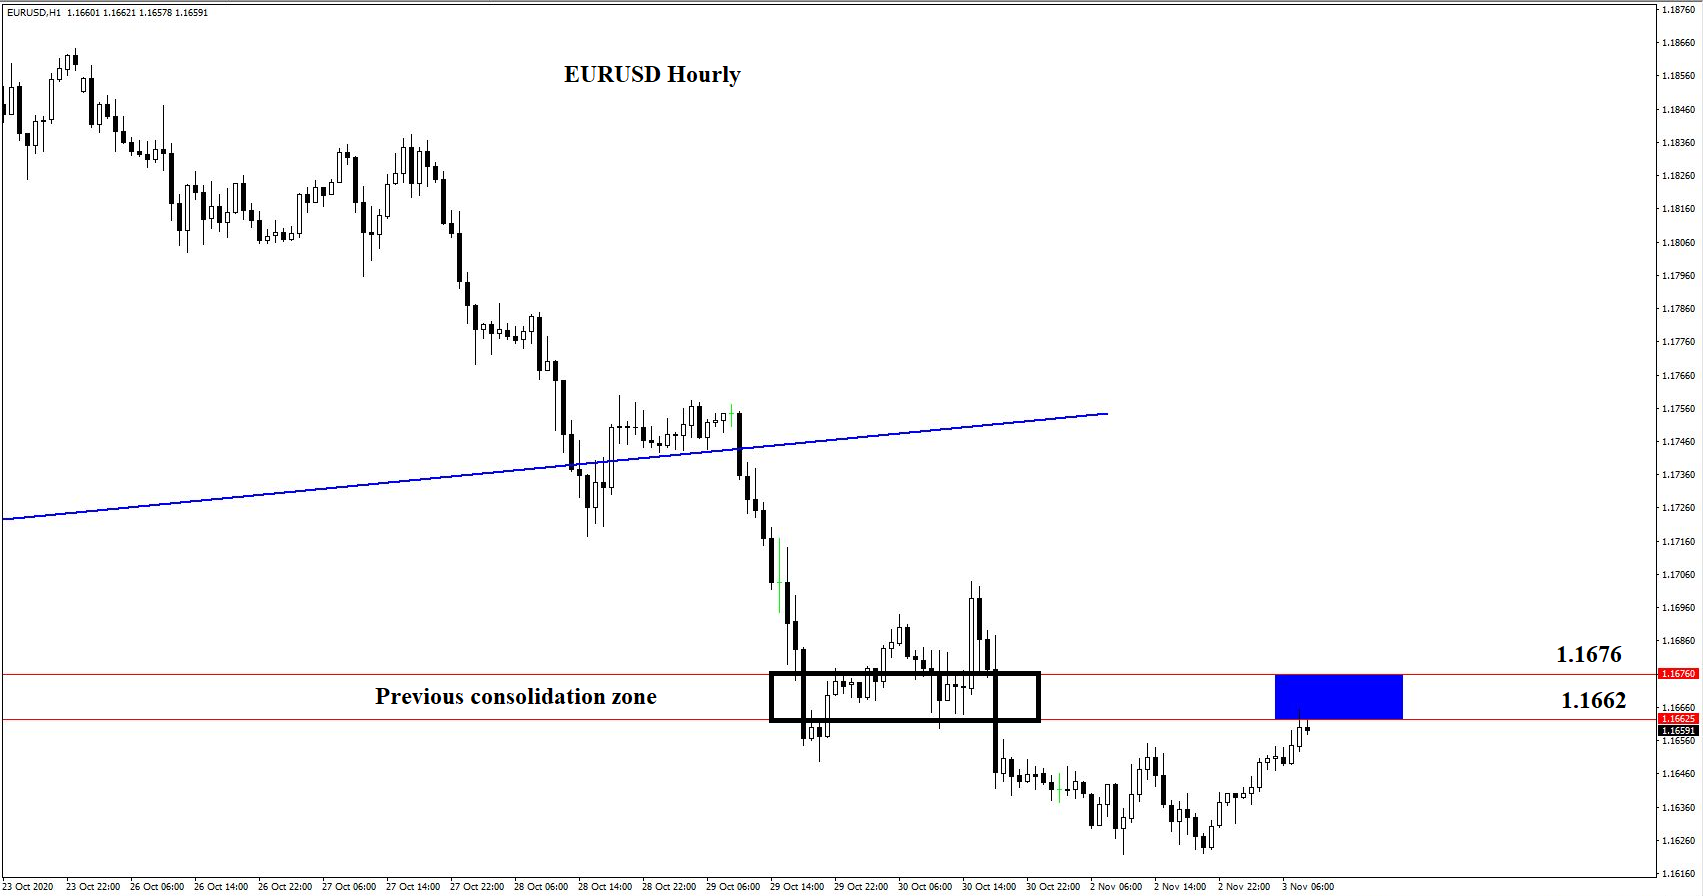
The hourly shows that prices have reached up to test the bottom of a previous consolidation zone, forming a Blue Box at 1.1662-1.1676.
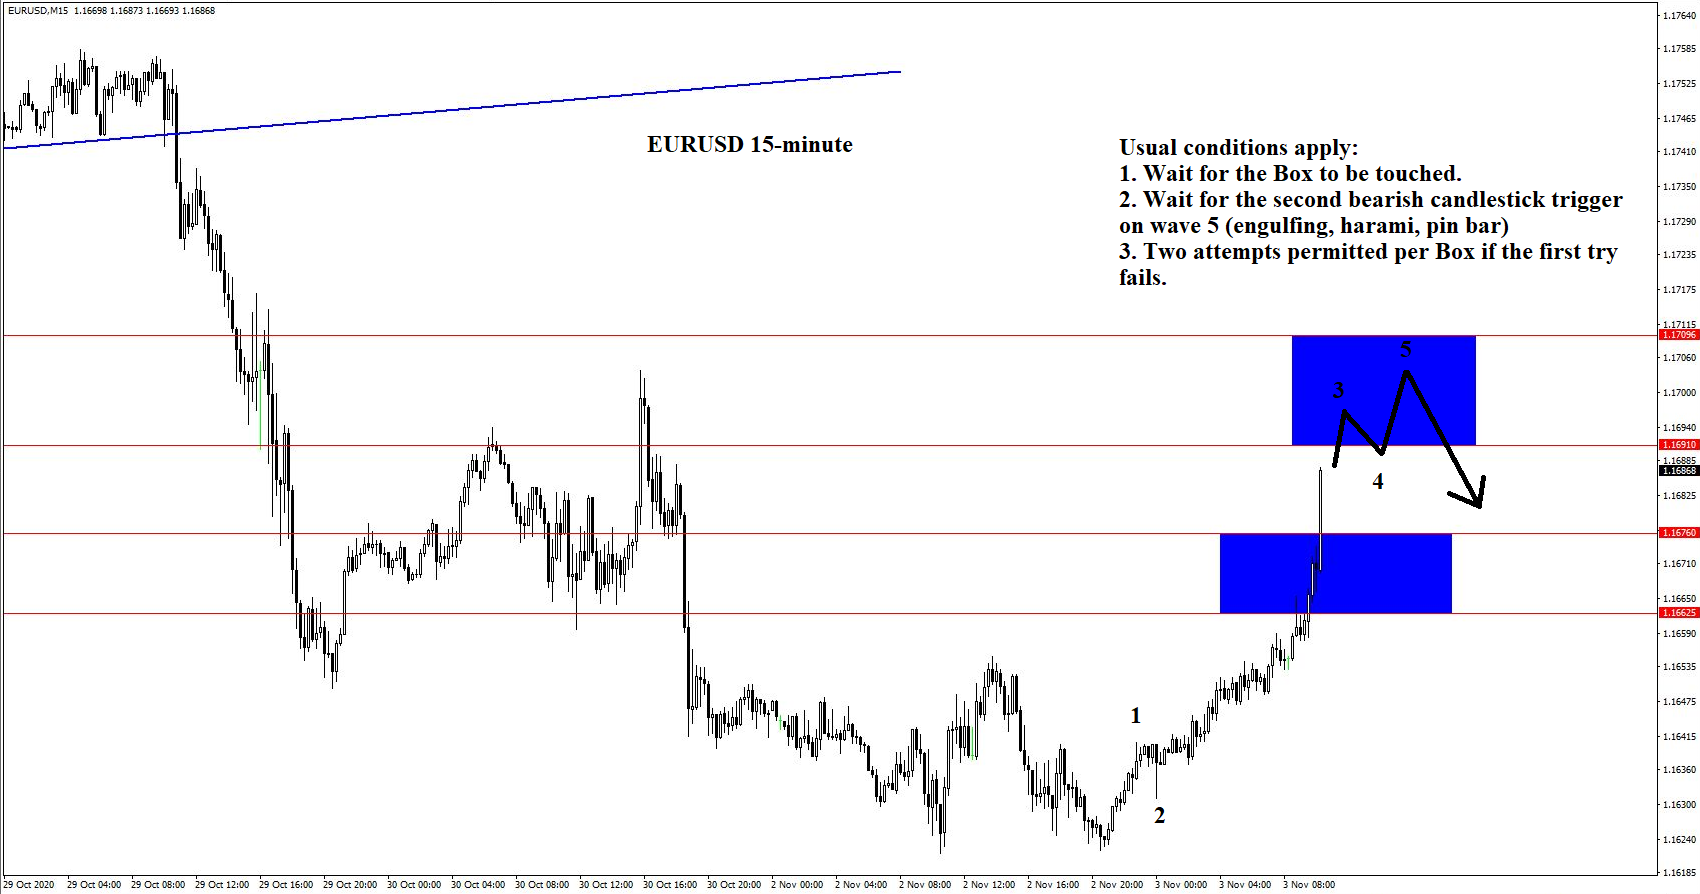
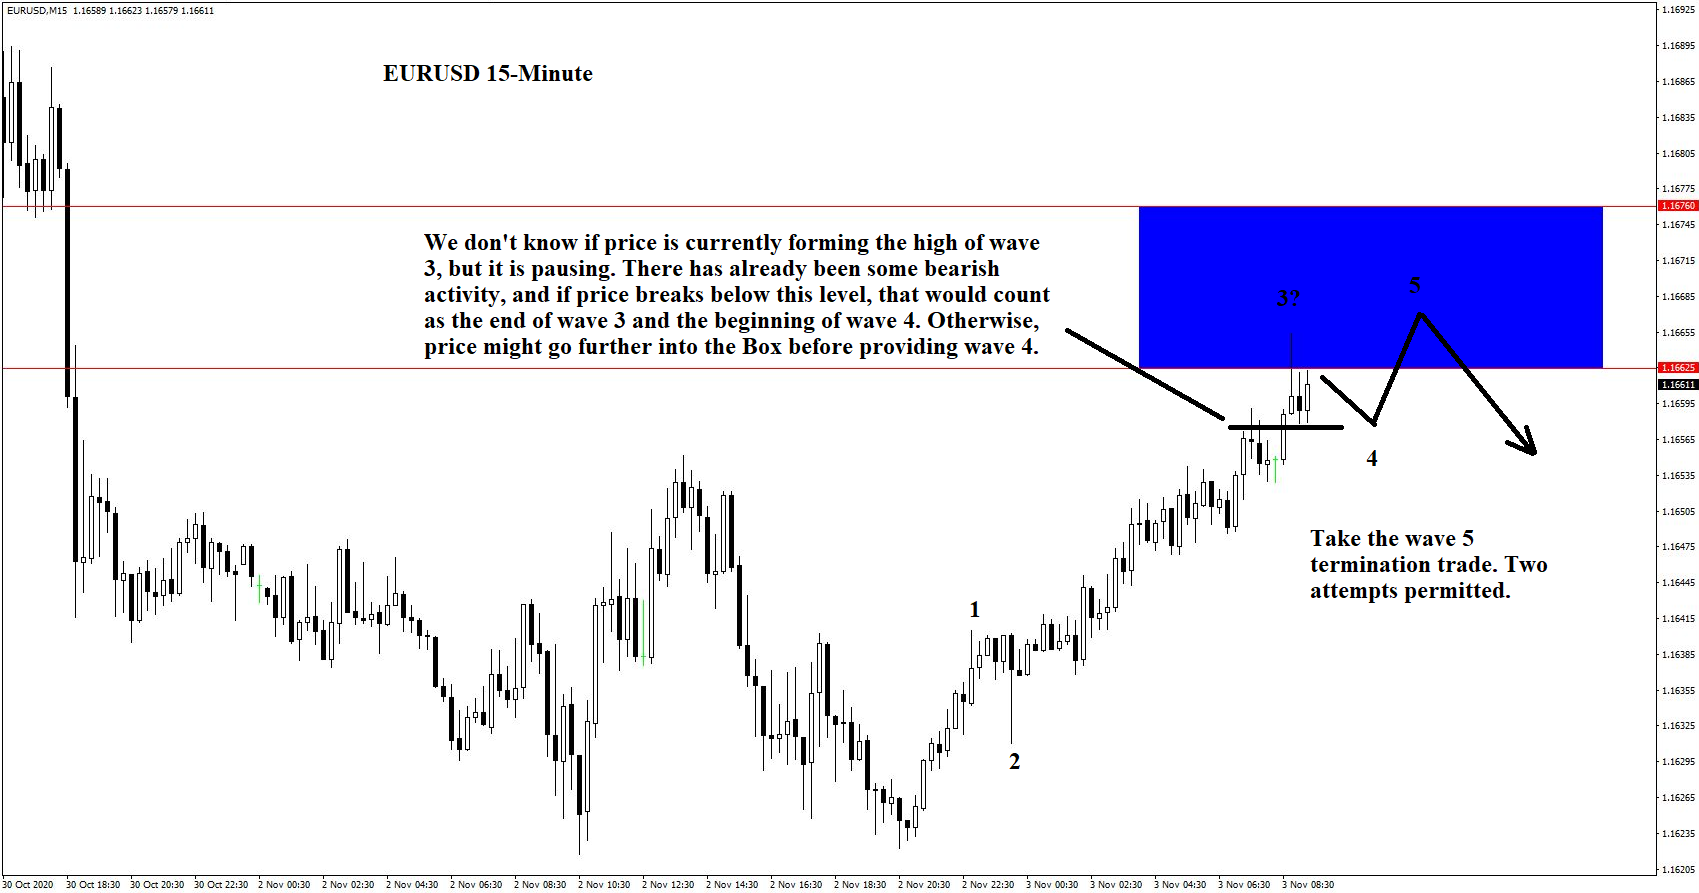
The trade setup should be familiar with blog readers by now. Take the second bearish candlestick pattern that forms after the Blue Box triggers. Price currently appears to be potentially creating the end of wave 3, so in this case, we would want price to break below the line noted to confirm the wave 4. If this happens, the trade would occur on the next high’s turning.
If prices do not confirm this, then traders should wait for another two highs to form before taking the trade on the bearish candlestick pattern (harami, bearish engulfing, pin bar) at the top of the second high. As usual, the Blue Box permits a second attempt if the first trade stops out.
The trade setup is in danger of being violated due to a bullish surge placing price near the top of its Blue Box on the 15-minute chart. However, the S&P has developed a similar trade setup in a lagging fashion on its own 15-minute chart on the 3320.24-3348.67 setup.
Due to the urgency of the post, the details are not repeated here. They are the same as for the Dow. The trade will set up if there are two bearish candlestick setups corresponding first to a wave 4 downturn and then after the termination of wave 5. Enter on the second setup. Try twice if the first time doesn’t work. Good luck!