The “Trick” of Moveable Resistance Zones

For those just joining the saga, the discussion of the setup for this trade is available here:

https://straighttalktrading.wordpress.com/2018/07/17/backing-up-to-the-next-resistance-zone/

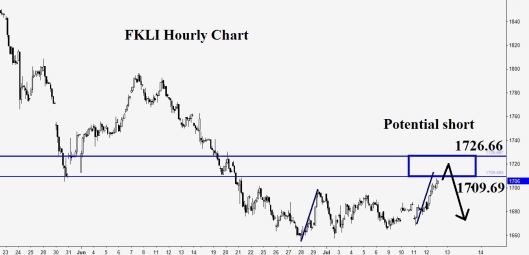
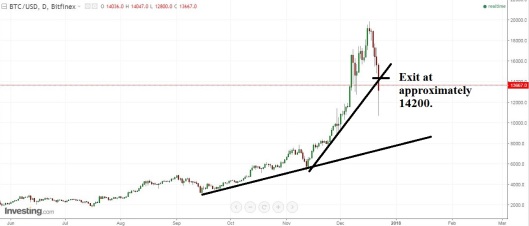
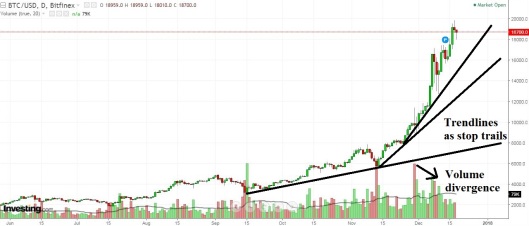
This is the most recent situation.July 19th 2018 FKLI Hourly Wave Count.jpg

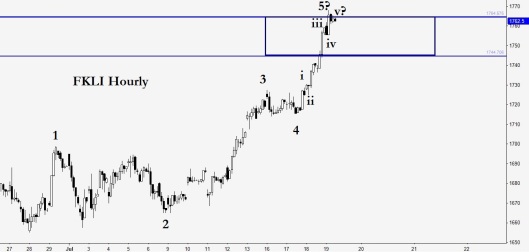
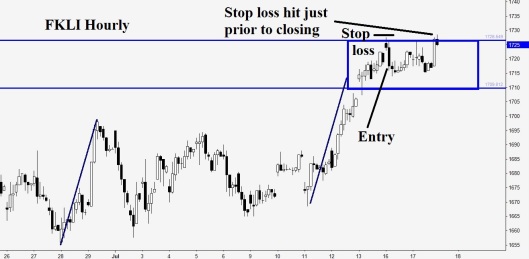
There is at least one hourly close beyond the top of the Blue Box identified in the previous post. I have often written for third party sites in the past, such as www.DailyFX.com. In those situations, this particular condition would render the Blue Box null and void, as there is always a slight lag between composition and publication, rendering it tricky for me to adjust any trade setups.

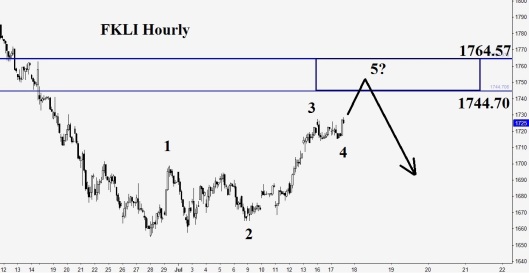
However, in this case, as this is Straight Talk Trading’s own blog, I can point out that the wave count is still valid. I can also point out that a smaller set of waves, with a very large wave iii, has developed. This is one of the rare situations in which adjusting the Blue Box slightly to account for the smaller wave setup is valid, and thus I will take the opportunity to do so here, as shown below.

July 19th 2018 FKLI Hourly Adjusted Box

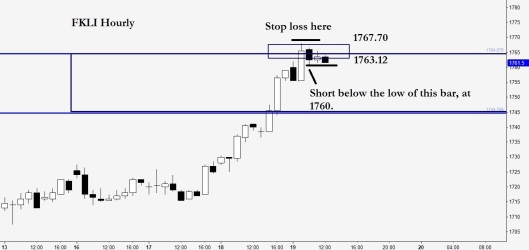
The adjusted Blue Box is 1763.12-1767.70. It is simply considered an extension of the original Box. This technique is only applied once, and in this case, will only permit one entry, whereas I am usually willing to try up to twice per Blue Box setup. In this case, price is so close to the high of the Box that a stop out would result in the Box being invalidated.

Should price continue upwards, it would probably be wise to step back and see what will happen next before making the next trading decision. It is extremely rare that price is able to break past two Boxes in a row without so much as a pause, but the extreme momentum upwards in the shorter timeframes of the past day is enough to give one pause. Nonetheless, rules are rules and trading plans are designed especially for these moments of uncertainty to guide our judgement. I shall continue to comment as the trade develops, should it trigger.

Good trading!

Kaye Lee
Head Trader Consultant
www.straighttalktrading.com


Backing Up to the Next Resistance Zone

For more details on this trade setup and trigger, see here:

https://straighttalktrading.wordpress.com/2018/07/16/setting-up-a-candlestick-trade/

The long and short of it was that the trade did not work out. The stop loss was hit just prior to the closing, as shown below.

July 17th 2018 FKLI Hourly Stop Hit

Whilst definitely annoying, this was hardly disastrous, as this style of trading requires the willingness to take a couple of stops in exchange for better potential reward. (By comparison, a client of mine did not take a stop as he was trading the same setup on the daily chart, where it did not trigger. That is a higher probability trade in exchange for lower reward-for-risk.)

For now, the playing field has shifted higher, as this resistance zone is now considered breached. Aggressive traders would stop and reverse, and this would be a valid response, although I am not inclined to be aggressive here, and thus would prefer to wait for this move to lose steam at the next stop, which is shown below.

17th July 2018 FKLI Hourly New Setup.jpg

Instead of a zigzag-type complex retracement, we now expect a five-wave retracement on the hourly chart. It may take awhile to reach and activate this area, but we will be watching it with interest.

Good trading.

Kaye Lee
Head Trader Consultant
www.straighttalktrading.com

Setting Up a Candlestick Trade

For those looking for the discussion of the original setup, you will find it in this post:

https://straighttalktrading.wordpress.com/2018/07/12/successful-traders-share-this-trait/

For awhile, it looked as if price would barrel through the resistance zone with barely a pause. However, that trade trigger came this morning.

July 16th 2018 FKLI Hourly

There were a total of three bearish indications before the trade triggered to the short side. The first was a bearish engulfing candlestick, which looked promising but provided no confirmation. Price did not trade below the low of that formation, which would have been the required trigger.

The second setup was the bearish harami. This was not the strongest indication, but if price had traded immediately short below the low of the black harami candlestick, it would have been a legitimate trade.

However, price gapped up today and created a pin bar that looked dubious. If traders had chosen to trade the break of the low of this bar short, they would have been rapidly rewarded. Unfortunately, we didn’t, as our proprietary entry rules did not permit this particular trade. It would have been beautiful.

Instead, we were stuck with the trigger on the break of the bearish harami, which has recently occurred. This entails a larger stop loss, above the recent swing high. We do not know how this trade will work out, but it seemed appropriate to post a discussion of the entry conditions.

Happy trading!

Kaye Lee
Head Trader Consultant
www.straighttalktrading.com

Successful Traders Share This Trait…

I am in an interesting position with respect to a colleague of mine. We disagree on where the FKLI, the Malaysian futures, is potentially going next. He believes it is going up. I believe the next best bet is down. Who is correct? Who knows?

Contrary to popular opinion, technical traders do not always know where the market is going with a high degree of certainty. However, we do know where there are chinks in the market armour, where trades MIGHT develop. Depending on the limitations and style of the trader, we favour different chinks. That is fine, and it is why we might end up with different opinions. The key trait that successful traders share, however, is that we are able to enter our trades with very small risk for very large potential reward.

Here is the trade as an example.

July 12th 2018 FKLI Daily.jpg

I believe the downward  momentum  of the trend isn’t spent yet. The trend is not quite at its end, although it certainly shows signs of slowing down. On the other hand, he believes that the downward trend is over, at least temporarily. We might even both be right – prices may move upwards briefly, in accordance with his beliefs, and he may be able to grab some points from the index, or the corresponding move in stocks. If he is absolutely correct, and this turns out to be a major low in the market, then he will have caught it very near the bottom – on the first higher high.

For my side, I would have two trades. I expect the market to go lower, and if it does, I would have a long trade soon after, as I agree that the trend does look very close to ending. However, in the mean time, I can actually trade to the short side, when prices reach a level of resistance.

July 12th 2018 FKLI Hourly.jpg

The hourly chart depicts my potential shorting zone: 1709.69-1726.66. Prices have risen nearly to the Blue Box. This is where you see the differences between and similarities of good traders. I am watching for a potential reversal here to continue the daily trend, and a short here could well result in an excellent trade moving towards a new low, or at least with a sufficient reaction for me to trade manage a scalp. My colleague is looking for this zone to break, which will give it room to rise. We both expect this to be a make-or-break situation, but our analytical styles bias us in different directions.

The zone might just be broken to the topside with no reaction for me to enter a trade whatsoever. (I’m actually looking for a small divergence with a candlestick entry.) Nonetheless, this is an interesting setup, because it shows that even with similar tools, traders can end up with differing viewpoints.

Kaye Lee
Head Trader Consultant
www.straighttalktrading.com

What Comes After the Bitcoin “Crash”?

This is the fifth post in the Bitcoin series. Here are the others, should you wish to catch up:

Post 1: Trading Entries in a Bitcoin Campaign
Post 2: Early Warning Signs of Intermediate Bitcoin Trend Exhaustion
Post 3: How the Worst of the Bitcoin Plunge was Avoided
Post 4: Catching the Low of the Bitcoin Plunge – A Trade Not Taken

“It’s a new world! Cryptocurrencies are here to stay! This is the start of a new paradigm – they will go up for (nearly) forever!”

If I heard the above cries too often beyond the inner circle of cryptocurrency fanatics, I would become concerned. New paradigm cries are extremely ominous in bubbles. Thankfully, after 22nd December 2017, apocalypse may have been postponed. With traders definitely feeling shaken after the volatility roller coaster shown in Figure 1, it will be awhile before we can decide if confidence has been permanently damaged.

24th December 2017 Bitcoin Daily Chart

Figure 1: Bitcoin’s Wild Ride!

Whew! What a ride! One could get exhausted just looking at it. Wouldn’t it be nice if we could trade a nice, steady, calm and peaceful chart like Figure 2’s, for similar returns?

24th December 2017 Bitcoin Daily Chart Log Scale Hidden

Figure 2: A Much More Peaceful, Bullish Chart

What if I told you it was possible? What if I told you, in fact, that it was possible to obtain exactly the SAME returns from the second chart as Bitcoin? Don’t look so surprised. It IS the exact same daily Bitcoin chart. Don’t believe me? See Figure 3. It is the same data, plotted using a log scale. That means that it has been re-scaled so that the rises and falls are similar in percentage terms. In fact, whilst looking at the chart, note how uniform the pullbacks have been since the beginning of 2017.

24th December 2017 Bitcoin Daily Chart Log Scale Symmetry.jpg

Figure 3: Bitcoin’s Daily Chart, Log Scale

It is funny how the more the world changes, the more it stays the same. In the world of stocks, this is an old trick. When an instrument has been rising (or falling) sharply in a short period, it is more logical make percentage comparisons than with numbers. That is what the log scale is designed to do. Note how much more clearly the earlier swing are displayed in this format. Note also how the latest “crash” in Bitcoin is simply a pullback of comparable log terms to retracements that have been occurring since the beginning of 2017. Would you call it a crash now?

Bitcoin may yet crash – nobody knows for certain. However, I wish to point out that inexperienced traders who focus just on the numbers will experience far more fear and greed than the ones who focus on percentage returns, which is what matters for long term survival. Make your decisions carefully, and may the trade be with you!

With my very best season’s greetings,

Kaye Lee
Head Trader Consultant
www.straighttalktrading.com

Catching the Low of the Bitcoin Plunge

This is the fourth post in the Bitcoin series. If you are just hopping on, here are the links to the other posts:

Post 1: Trading Entries in a Bitcoin Campaign
Post 2: Early Warning Signs of Intermediate Bitcoin Trend Exhaustion
Post 3: How the Worst of the Bitcoin Plunge was Avoided

As Bitcoin plunged thousands of pips on that fateful day, 22nd December 2017, I was still mindful that it seemed like the move was being somewhat artificially generated. The fact that it was occurring on a (Fri)day just prior to Christmas, when most retail traders would be distracted was also not lost on me. I was watching for signs of potential accumulation. And soon, I saw some…in Figure 1.

24th December 2017 Bitcoin Hourly Hidden Accumulation

Figure 1: Sneaky Signs of Buying

Figure 1 shows the hourly chart of Bitcoin (BTC/USD), which behaved fairly normally until the right edge. The indicator shows accumulation and distribution, and is a way of analysing volume. As the plunge worsened, I began to wonder if an entry was imminent, especially as the indicator abruptly leapt up, indicating buying had begun. As the the lessened volume on the daily chart had foreshadowed the Bitcoin plunge, this little nugget of information began to hint at a potential entry. Just as before, the volume signal was taken as  a foreshadowing, not as an entry signal. I began calculating support levels.

Three hours later, price had taken one last plunge towards a level of support, as shown in Figure 2.

24th December 2017 Bitcoin Hourly Entry Setup

Figure 2: Bitcoin Support and a Pin Bar

My setup indicators were beginning to go long, and just then my phone lit up with a message from a colleague. It gloated, “Pin bar on hourly Bitcoin. Dare you go long?”

The fact was, I didn’t. I had no intention of wrecking Christmas weekend, and it was already late where I was. With traders (and myself) distracted over the holiday season, I was simply not ready to take a trade that I could not manage properly. Nonetheless, this occurrence highlighted a point I have often noted – experienced traders tend to show up at the same levels in the market. I know – it’s weird. It’s almost as if we know a thing or two.

To keep a long story short, Bitcoin bounced upwards – see Figure 3. I did not enter, and I do not regret it. I believe that there is short term volatility due in the instrument, and I intend to enjoy Christmas. Season’s greetings!

24th December 2017 Bitcoin Hourly Entry Result

Figure 3: Result of the Entry

Kaye Lee

Bitcoin Plunge? How the Worst was Sidestepped

This is a continuation of the posts describing how I designed a Bitcoin trading campaign  (Post 1 in the Bitcoin series) and the early warning signs of intermediate trend exhaustion (Post 2 in the Bitcoin series). Prices had been falling for several days in a row now, as shown in Figure 1. However, there was no real reason to panic. Prices had been rising on shallow daily pullbacks for months, and a deeper retracement was only to be expected. Furthermore, at that stage, the pullback size was reminiscent of a recent one involving a volatility shake, also shown in Figure 1.

24th December 2017 Bitcoin Pre-plunge.jpg

Figure 1: Bitcoin Pre-plunge

As one might point out in hindsight, we could have terminated the trading campaign then. However, as the average trading campaign price was favourable relative to where it was, a decision was made to hold out in case the trend resumed with a roar, without allowing for a proper re-entry. This is a balancing act which traders tend to get confused about, due to it not having been accounted for in the trading plan.

I was now watching with some interest, looking for some signs of a trend resumption. However, prices were also coming down to the pre-determined exit level. On 22nd December 2017, during the early hours of the Asian trading session, our rules forced an exit at an average price of approximately 14200. (See Figure 2 below.) The return on the entire trading campaign, based on maximum capital risked at any point, was a little over 100%. It certainly wasn’t the several hundred or thousand percent gain that others experienced, but it was done with extremely controlled risk. I consider it a satisfactory campaign.

24th December 2017 Bitcoin Exit.jpg

Figure 2: The Bitcoin Trade Exit

I wish to point out that the exit was taken in the upper third of the day’s range, prior to the madness of the plunge. If there had been hesitation in the execution of stop losses, the situation could have turned ugly very quickly, as prices dropped to the 11000 region.

Ultimately, prices did bounce up from the low near the end of the day, and some might wonder if it would have been wiser to stay in. I think not. Staying would have meant a potentially uncontrolled loss. No one knew that a bounce would occur, although, as I have pointed out, the fact that I had been anticipating another opportunity to scale into the trade should tell the reader that I was still bullish.

Was there a re-entry? Yes. Did I take it? No. Why? I did not feel like making bad decisions just after a successful trading campaign, and had no intention of wrecking Christmas. Nonetheless, if you wish to read about the trade setup that was not taken, it is over here.

Good trading!

Kaye Lee
Head Trader Consultant
www.straighttalktrading.com

This Little Trick Avoided the Bitcoin Bloodbath

There was a panic as Bitcoin and other cryptocurrencies began to plunge as we moved into the weekend heralding Christmas in 2017. This is part 2 of a Bitcoin series. If you have not read it yet, the trades taken during the Bitcoin campaign are shown here:

https://straighttalktrading.wordpress.com/2017/12/24/this-is-how-we-traded-bitcoin/

With a trading campaign fully loaded up, I was ignoring most of the cries of “Bubble!” that pervaded the marketplace. The charts would tell me how to react, and it was beginning to tell me something slightly worrying. In Figure 1 below, the first sign of trouble was the fact that volume was beginning to decline, in spite of the rapid rise of Bitcoin. This meant that each successive giddy high was demonstrating less and less participation.

18th December 2017 Bitcoin Volume Divergence

Figure 1: Volume Divergence and Stop Trails

A person with an extremely heavy position would take the divergence itself as a sign to begin to unload. I considered the trading position small enough that it was insufficient to justify this. In addition, it was being funded entirely by market profits, so it made sense to see how far this balloon would rise. Nonetheless, stop losses were being carefully planned.

The general idea was that as prices had risen to such profitable levels, it was reasonable to give back 25% of the maximum paper profit. Although might seem a lot, it was a good bargain in exchange for the potential to ride a wave up to the moon, remote though that seemed. Talking heads from various quarters were either touting or reviling Bitcoin, and I was determined to ignore their opinions in favour of what the market told me.

More disturbingly, I was beginning to notice increasing advertisements and marketing materials from Bitcoin gurus. Whereas up till now there had been relatively mixed opinions on cryptocurrencies in general in my circle, the mood was beginning to turn from extreme scepticism to uncertain regret at missing the boat. Both these events indicated that we were approaching bubble danger territory. It is a fairly reliable dictum that a market becomes infinitely more dangerous when it becomes profitable enough for gurus to emerge.

Someone else who might have had better fortune and foresight than me to have entered the Bitcoin game earlier might have chosen to trail their stops on any of the trendlines indicated in Figure 1. The game was on!

Good trading!

Kaye Lee
Head Trader Consultant
http://www.straighttalktrading.com

This is How We Traded Bitcoin

It has been awhile since I have posted, so here is a quick review of Bitcoin’s exciting year. I have been watching it with some interest, and got wrapped up in the price action with a relative of mine. Before getting started, let me say that there is certainty regarding whether Bitcoin is a bubble – it probably is, and it certainly is behaving like one. Nonetheless, it trades just as you would expect any other currency or financial instrument to.

The key is to realise that in an bubble, there is no telling how far it could go, but as long as there is a super-trend in place, pullback trading is extremely profitable. In Figure 1, I have identified the various entries we took. There was no additional entry, and no, this is not a chart made up later. It would be nice to say that every trend I traded was entered at the price swing low, as it was in this case, several times in a row. However, that would be unrealistic. Nonetheless, it may prove educational for traders to study the entry levels in this case.

18th December 2017 Bitcoin Entries

Figure 1: Bitcoin Entries

I would also love to tell you that we held the position all the way through, never taking profits. That is not true. Each swing trade was scaled out partially very quickly, reducing the size by a third or half. This was because we were cognizant of the fact the situation could reverse very quickly, and the idea was to take partial profits quickly, leveraging ourselves into a position where it was risk-free as quickly as possible. In fact, by the time we reached the right edge of this chart, the trading campaign was essentially risk-free. The exposure and risk was entirely upon the profits gained.

This was just as well, as we were only a short distance away from the pre-Christmas plunge, which I will talk about next…

Good trading!

Kaye Lee
Head Trader Consultant
http://www.straighttalktrading.com